Update 01/2025
Name change from SAP Data Warehouse Cloud to SAP Datasphere. Some links may break
In this blog post, I want to share an idea of how you can generate month-to-date (MTD), quarter-to-date (QTD), and year-to-date (YTD) values in SAP Datasphere (DSP). This is only one way, I think there are several other ways how you can solve this issue. I am happy to discuss your ideas in the comment section. In my old post, I describe the same logic for SAP HANA Calculation Views.
Control Table
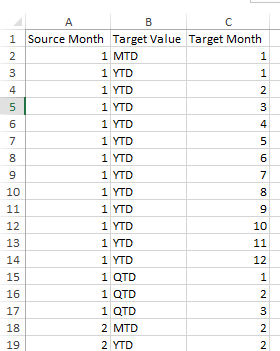
The starting point is a control table that has the following structure:

The whole table has entries for each source month.
Data Table
After we have now the control table for the calculation, we now create a view. This is what the data looks like:

Data Model
Now we have the data and the calculation table, we just create a simple join to the data, which you see in the following screenshots.


Output

SAP Analytics Cloud Output
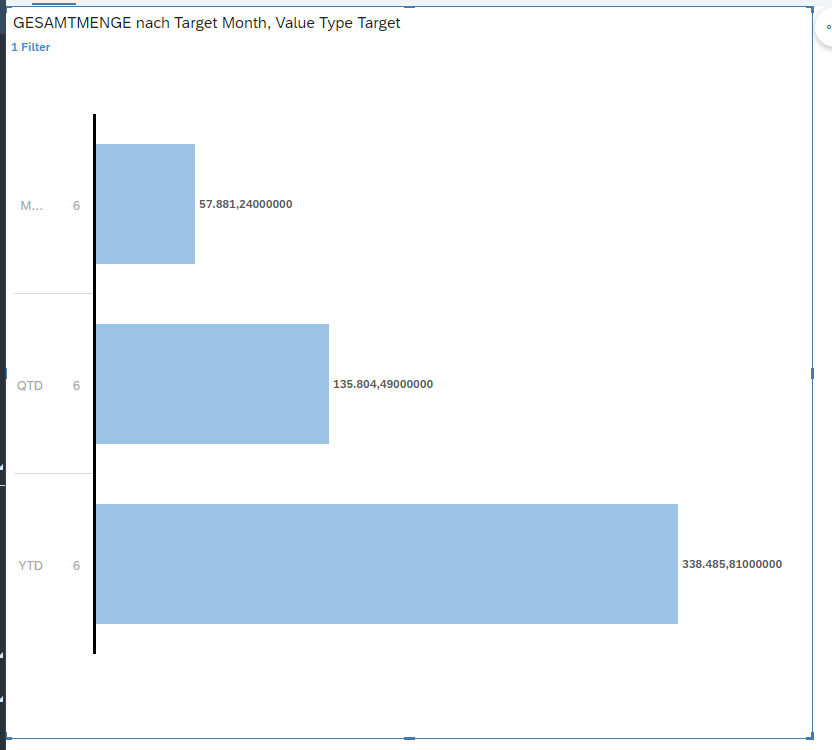
With the value type, we can now filter our data for MTD/QTD/YTD and the corresponding month. In the SAC, it will look like this:

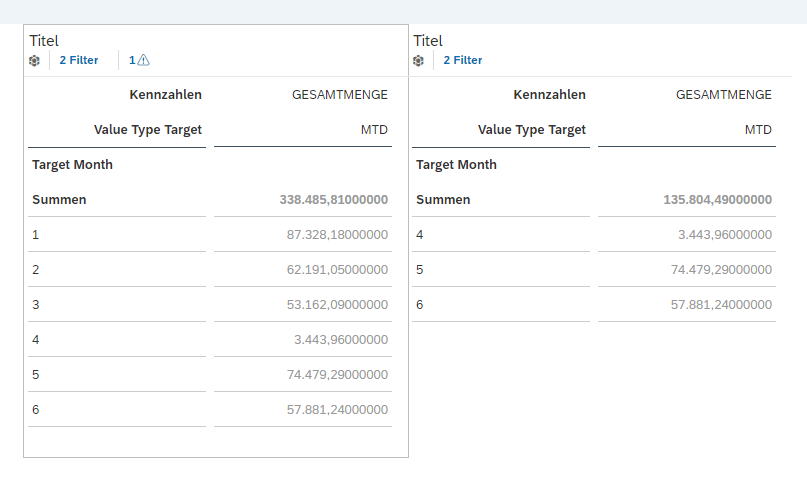
In this example, I filter my data for June, and so I see directly the aggregated values. For the MTD you see the month value of 578881,24. For the QTD you get the values for the second quarter of the year and for the YTD you get the values of the entire year. Here are the MTD values to validate the chart

Conclusion
As you see, it works perfectly and is very fast. I had a similar post where I used this logic in one on Premise SAP HANA DB.
What do you think about this solution? I know this is only one approach and there are more out there. Maybe someone has a better solution?
author.

Hi,
I am Tobias, I write this blog since 2014, you can find me on Twitter, LinkedIn, Facebook and YouTube. I work as a Senior Business Warehouse Consultant. In 2016, I wrote the first edition of Analysis Office - The Comprehensive Guide. If you want, you can leave me a PayPal coffee donation. You can also contact me directly if you want.
Subscribe
- In my newsletter, you get informed about new topics
- You learn how to use Analysis Office
- You get tips and tricks about SAP BI topics
- You get the first 3 chapters of my e-book Analysis Office - The Comprehensive Guide for free
You want to know SAP Analysis Office in a perfect detail?
You want to know how to build an Excel Dashboard with your Query in Analysis Office?
You want to know how functions in SAP Analysis Office works?
Then you have to take a look into Analysis Office - The Comprehensive Guide. Either as a video course or as an e-book.


Write a comment