
It's just before the summer break, and I want to share an idea on how to get a dynamic prior year in an analytical model.
There are several questions in the SAP community how to get such a result as it was used in SAP BW. Like this one https://community.sap.com/t5/finance-q-a/offsetting-input-parameters-in-datasphere-s-analytic-models-restricted/qaq-p/13723947
In this post, I want to share an idea on how to get such an offset in SAP Datasphere. Let's go to our fact view and add some logic that we will use later in our analytic model.
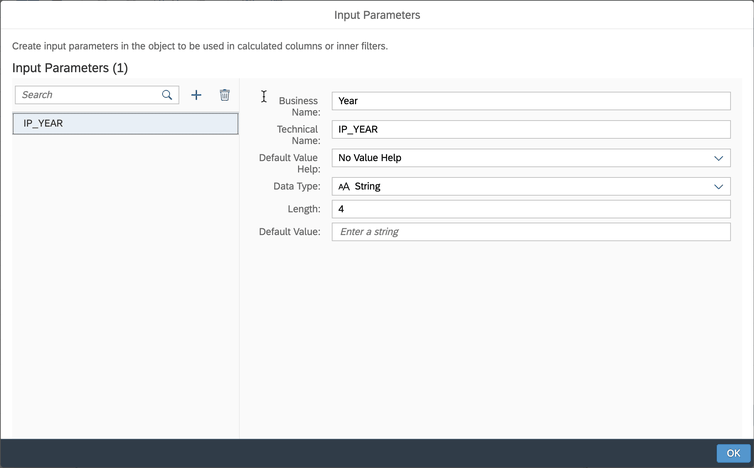
First we will add an input parameter to the bicycle data model, later I will describe another way if you don't want to use an input parameter.
The input parameter in this case is called IP_YEAR, has no input help, and has a string data type with a length of 4.
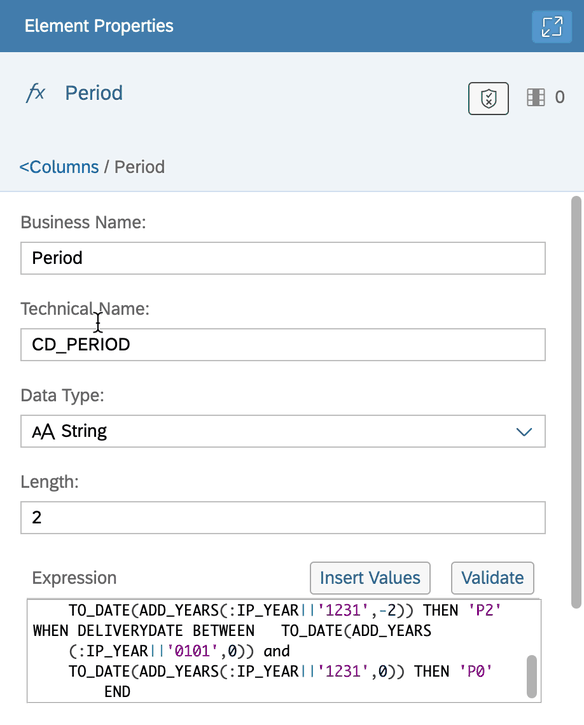
Now let's use the input parameter to complete the logic. Add a calculated column to the view. If you are building the view in pure SQL, add the logic accordingly.
The new column provides the following information that we will use later. The current year is period 0, the previous year is period 1, and the year before that is period 2. I use the delivery date as the reference data.
The CASE statement looks like this
CASE WHEN DELIVERYDATE BETWEEN TO_DATE(ADD_YEARS(:IP_YEAR||'0101',-1)) AND
        TO_DATE(ADD_YEARS(:IP_YEAR||'1231',-1)) THEN 'P1'
        WHEN DELIVERYDATE BETWEEN       TO_DATE(ADD_YEARS(:IP_YEAR||'0101',-2)) AND
        TO_DATE(ADD_YEARS(:IP_YEAR||'1231',-2)) THEN 'P2'
        WHEN DELIVERYDATE BETWEEN       TO_DATE(ADD_YEARS(:IP_YEAR||'0101',0)) AND
        TO_DATE(ADD_YEARS(:IP_YEAR||'1231',0)) THEN 'P0'
END
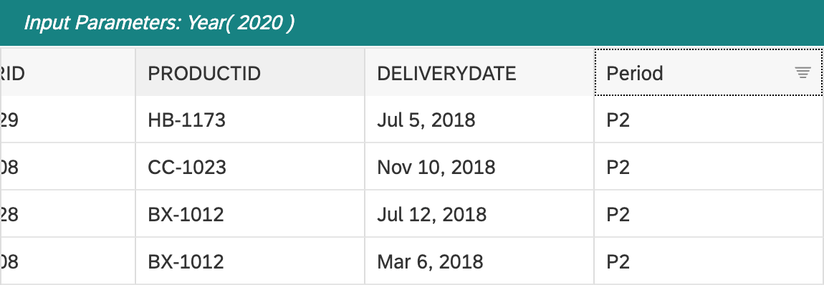
The 2020 data preview now looks like this:
Now we have all the requirements for the analytical model to create a dynamic selection. So we open the analytic model and see what it looks like
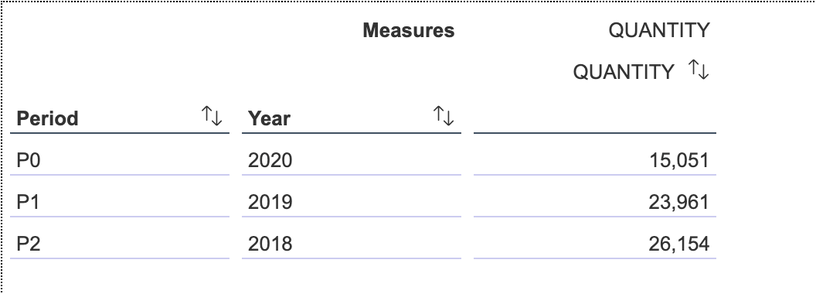
The analytic model shows the year deviation perfectly. Now the next step is to create separate key figures to get a better analysis. Go back to the analytical model and create 3 restricted measure. One for period 0, one for period 1 and the last one for period 2.

After creating all the restricted measures, we see this in the analytic model

Now we can add the product ID to the rows and have a perfect overview of the sales quantity.

As I wrote earlier, this is based on a variable that you have to set. If you don't want to use a variable and just want to select the actual year with no flexibility, you could use the SQL function current_date instead of the input parameter in the view.
Conclusion
This is one idea, and maybe you have a better one you want to share. So I would love to read from you in the comments. I think it is a pretty simple solution to solve the previous year problem in an analytic model and can be used very easily.
author.

Subscribe
- In my newsletter, you get informed about new topics
- You learn how to use Analysis Office
- You get tips and tricks about SAP BI topics
- You get the first 3 chapters of my e-book Analysis Office - The Comprehensive Guide for free

You want to know SAP Analysis Office in a perfect detail?
You want to know how to build an Excel Dashboard with your Query in Analysis Office?
You want to know how functions in SAP Analysis Office works?
Then you have to take a look into Analysis Office - The Comprehensive Guide. Either as a video course or as an e-book.
Write a comment
MK (Wednesday, 17 July 2024 14:56)
This is really bad, that this is not working like with Text replacement.
Have this exact requirement to do dynamic quarters/month columns as keyfigures and cannot solve it, but only like you did with an offset value and a generic keyfigure name......
Attila (Friday, 09 August 2024 12:00)
Nice explanation and a smart approach! I have to migrate tools to DataSphere from BW750, you can imagine all the selections that were implemented and have to be remodeled! thanks a lot for the tip!