blog.
Exchange Datasphere Topics @ DSAG TG
Yesterday I was at the DSAG TG Datasphere. DSAG is the German SAP user group. The TG Datasphere is a topic group about SAP Datasphere.
Thanks Hakan for the invitation to the Porsche Campus in Zuffenhausen. It is always great to see the campus and all the nice sports cars.
But back to the topic. The agenda was packed with lots of slots, including 3 speed dating project experiences. This approach was cool (for the audience, the speaker has to do the presentation 3 times ;) )
But the first presentation was by Fabian about the SAP Data & Analytics Strategy. Here we heard all about SAP Business Data Cloud (BDC) and the strategy for enterprise data. There was also a detailed answer on how to deal with the old BW in the Private Cloud Edition (PCE) and what SAP's approach is here.
Get all table sizes and records in SAP Datasphere
If you come from the good old SAP Business Warehouse, you will remember the DB02 transaction. This transaction could show you all the tables in your system and how big they were. I showed an example on LinkedIn last year
Get all exposed views from SAP Datasphere
Now that we know how to authenticate to the SAP Datasphere API. We can now look at my example that I posted on LinkedIn last year. The goal is to get all the views that are exposed for consumption. If you set this flag, you can consume this view with a 3rd party tool such as PowerBi.
So if a view is flagged as exposed for consumption, this could be a data leakage issue if there is no Data Access Control (DAC) in place. So I also want to see if a view is exposed and if so, if it has a Data Access Control assigned to it. This allows me to identify incorrectly exposed views and see if anyone has access to data without DACs.
All code examples are available on my GitHub repository.
Every tool has the authentication part, so I moved it to a separate class. If you want to know how to build it, read the last blog post.
1. Start the program
SAP Datasphere API and Python Authentication
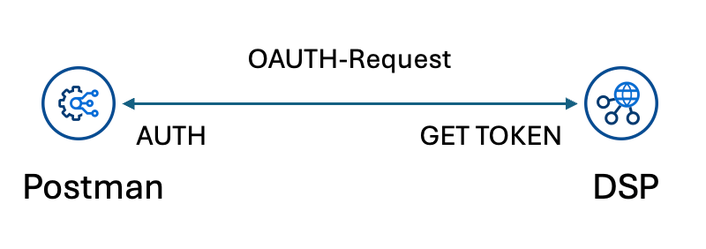
Now that we know how to get data from the SAP Datasphere API using Postman, I want to automate the steps using Python. In this post, I implement authentication via OAuth. I use the two existing libraries OAuth2Session and urllib.parse.
To create the OAuth request we need the secret, the client ID, the authorization URL and the token URL. I stored all this information in a JSON file so I can read and process it. Where to get this information can be found in the earlier post. So we need to read the JSON file first to get all the parameters.
secrets_file = path_to_the_secret.json

f = open(secrets_file)
secrets = json.load(f)
print(secrets)
Next, we need to encode the client ID, as described by Jascha in this post. I use the urllib.parse.quote functionality for this..
client_id_encode = urllib.parse.quote(secrets['client_id'])
Deeper Look into SAP Datasphere API
Now that we know how to use Postman to send an API request to SAP Datasphere and receive data. We can now take a closer look at the API and what we can do with it. At api.sap.com we get different API endpoints, I want to focus on the consumption part. The API reference for the consumption part allows us to consume relational and analytical models.
Let's start with the relational models and retrieve the data with Postman to see some results. The relational API endpoint can be accessed at this URL
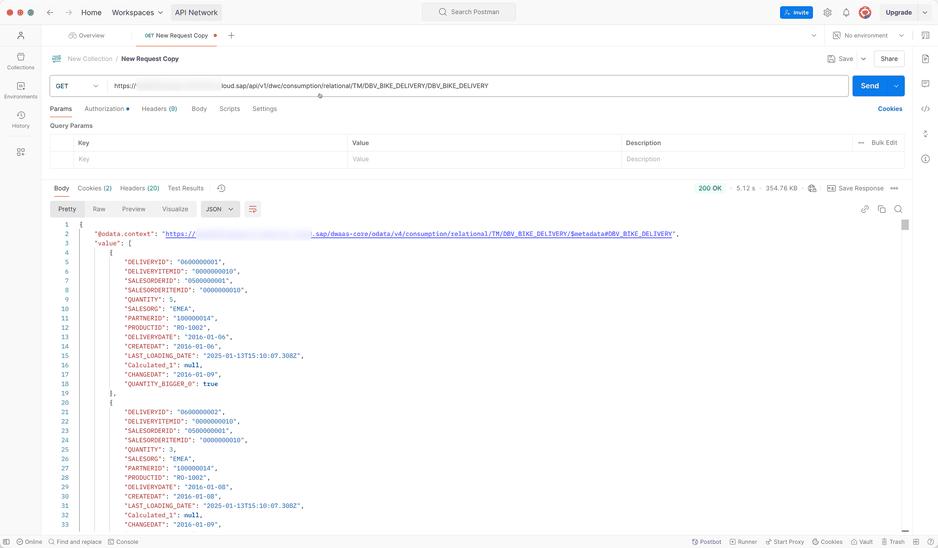
https://xyz.eu10.hcs.cloud.sap/api/v1/dwc/consumption/relational/{space}/{asset}/{technical_object}
You can find the exact description in the API catalog. So I won't copy and paste the content here. Now let's get the data with the above URL. My view is called DBV_BIKE_DELIVERY. If I now use my OAuth from the last post, I get the data directly in Postman.
Create API requests in SAP Datasphere with Postman
This is the first in a series of articles about the SAP Datasphere API and what you can do with it. I will start by explaining how to configure the OAuth and start with the first request using Postman. Postman is a tool for creating requests to web services.
So let's dive into it. If you want to consume the SAP Datasphere API, you need to find the right endpoints. A good place to start is api.sap.com. But how can we test and see if the request is correct? If we get the right result?
In this post, I will go through the configuration of Postman that allows you to send requests and also receive data from those requests. To do this, we use OAuth technology. I won't explain what OAuth is. If you are interested, take a look at Wikipedia.

Dynamic filter push down in SAP Datasphere
Dynamic source filtering is a big issue in SAP Datasphere. There are several approaches that may work for one, but not for another.
The discussion started again on LinkedIn after I read a post about dynamic filtering that was set with a fixed filter. Wanda then showed us a solution he uses to filter data. But Christopher pointed out that the filter is not pushed down to the source when you use a DP agent, e.g., the ABAP connection.
I had in mind that there was a blog post about how to push a filter down, even on an ABAP connection. So I tried Wanda's idea and combined it with the other knowledge. This blog post will show you how it works.
If you already know s-note 2567999, you know that you can filter data with a stored procedure. And as of June, you can run stored procedures directly in task chains. This is a really nice feature. But back to the other solution.
First, we need a local table to store the load parameter for this approach. The loading table is just to set the parameter easily and not always in the coding.
It is quite simple. 3 columns, one for the application, one for the parameter and one for the value. It may be different on your approach, but keep in mind to adjust the coding as well.
SAP Datasphere: Dynamic previous year in an Analytic Model
It's just before the summer break, and I want to share an idea on how to get a dynamic prior year in an analytical model.
There are several questions in the SAP community how to get such a result as it was used in SAP BW. Like this one https://community.sap.com/t5/finance-q-a/offsetting-input-parameters-in-datasphere-s-analytic-models-restricted/qaq-p/13723947
In this post, I want to share an idea on how to get such an offset in SAP Datasphere. Let's go to our fact view and add some logic that we will use later in our analytic model.
First we will add an input parameter to the bicycle data model, later I will describe another way if you don't want to use an input parameter.
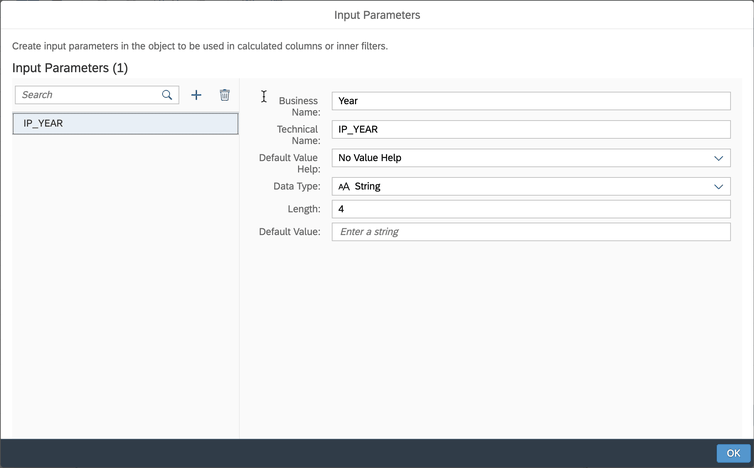
The input parameter in this case is called IP_YEAR, has no input help, and has a string data type with a length of 4.
SAP Datasphere Hierarchies like in SAP BW
In this post I want to describe how you can use hierarchies in SAP Datasphere just like in good old SAP BW.
To be able to use a hierarchy in SAP Datasphere like in SAP Business Warehouse, you need an object with the semantic type "Hierarchy with Directory".
There are several blog posts on this topic that explain it in detail:
- https://blogs.sap.com/2024/01/08/creating-a-hierarchy-with-directory-in-sap-datasphere/
- https://blogs.sap.com/2024/01/15/walkthrough-of-different-enterprise-scenarios-via-community-content-package-gl-account-external-hierarchy-with-replication-flow./
- https://blogs.sap.com/2024/01/15/an-introduction-to-hierarchy-with-directory-in-sap-datasphere/
- https://blogs.sap.com/2024/01/15/modeling-a-basic-hierarchy-with-directory-in-sap-datasphere/
- https://blogs.sap.com/2024/01/15/modeling-an-advanced-hierarchy-with-directory-in-sap-datasphere/
- https://blogs.sap.com/2024/01/15/guidecreate-sap-s-4hana-external-gl-account-hierarchy-within-sap-datasphere-through-community-content-packages/
The entity relationship model for hierarchies with directories looks like this:
Review 2023 and outlook
I know it's been a long time since I wrote the last post, and also make some housekeeping on the site. But the last quarter was as always very busy with different topics. I have now four pilot projects with SAP Datasphere, which I have to manage and develop the cool stuff. 😉 For example, how to use the command line interface (CLI) for SAP Datasphere to create views or tables based on a remote table. I had a really cool meeting with Ronald & Tim about this topic - Thank you guys for the input, now I have more ideas and less time.
I also developed some cool quarter slices in my projects to fulfil the customer needs. But besides the Datasphere projects I had this year, I also did a lot of other stuff. Let's start in March with the DSAG Technologie Tage in Mannheim. It was quite fun. You find all slides and posts on LinkedIn.
Consume hierarchies with nodes in SAP Datasphere
It was quite a bit silent here. That's a fact. I had a lot on my plate since I have a new job and also before the promotion. But now I have a super cool topic on my mind I want to share with you.
Hierarchies are a common topic in companies. They offer the business users' flexibility to navigate in the frontend reports. In this example, I flatten the hierarchy structure to consume a hierarchy with text nodes and infoobjects. The Product Group hierarchy looks like the following screenshot.

Datasphere Analytic Model is released
Update 01/2025
Name change from SAP Data Warehouse Cloud to SAP Datasphere. Some links may break.
Datasphere Analytic Model
Update 01/2025
Name change from SAP Data Warehouse Cloud to SAP Datasphere. Some links may break.
Custom Slide Shows in Microsoft PowerPoint
It has been a while since I wrote the last blog post. But there happened a lot in the last two months. We had our Deep Dives about Self Service with SAP Data Analytics Cloud Architecture and I had also some weeks of vacation. Now I am back from my vacation, and now I want to share some ideas I had in the last months.
This post is about Microsoft PowerPoint and how I use it to create a master PowerPoint file for different purposes. The idea was to have one place for all my SAP Data Warehouse Cloud slides and use them in different customer scenarios.
Therefore, I search a little what I can do. If you have Microsoft Office 365, PowerPoint has the option of Custom Slide Shows under the tab Slide Show.

Analysis for Office 2.8 SP14 is available
Unfortunately, I didn't make it to publish the post in the last month. There were several reasons that I didn't make it, like the internal BI days or to prepare the next deep dive for Data Warehouse Cloud. But back to topic. SAP published Analysis for Office 2.8 SP14. Maybe there is something with the SP14 because Analysis Office 1.4 had also a SP14 before Analysis office 2.0 was released. So perhaps we see some new feature in the future?
But back to Analysis for Office 2.8 SP14. Now you are able to connect to Data warehouse Cloud and consume the analytical data sets directly in Excel. This is the biggest update with for a long time with features. The last updates were mostly bug fixing and some technical setting parameter, but nothing what is fascinating.
Besides the function in Analysis Office 2.8 SP12 repeat titles of a crosstab. The latest version also offers a new API method called SaveBwComments and some new technical settings like
- AllowFlatPresentationForHierarchyNodeVariables
- SapGetDataClientSideValidationOnly
- UseServerTypeParamForOlapConnections
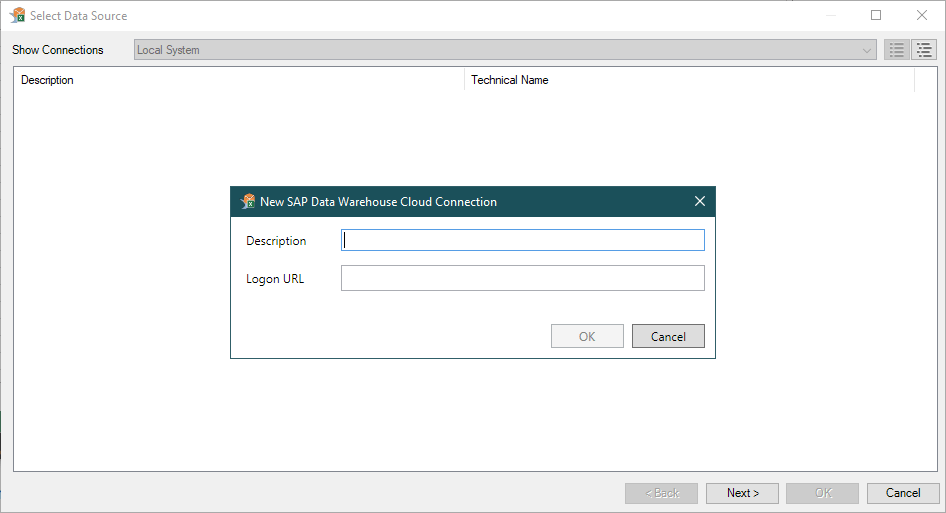
But for me the best part is now the Data Warehouse Cloud connection. For this, you have to create a connection in the Insert Data Source dialog.

Using SAP Datasphere bridge to convert SAP BW 7.4 objects
Update 01/2025
Name change from SAP Data Warehouse Cloud to SAP Datasphere. Some links may break.
Create a parent-child hierarchy in SAP Datasphere
Update 01/2025
Name change from SAP Data Warehouse Cloud to SAP Datasphere. Some links may break
Another MTD/WTD/QTD/YTD calculation in SAP Datasphere
Update 01/2025
Name change from SAP Data Warehouse Cloud to SAP Datasphere. Some links may break
MTD/QTD/YTD Calculation in SAP Datasphere
Update 01/2025
Name change from SAP Data Warehouse Cloud to SAP Datasphere. Some links may break
Analyze Apple Health data with Python
It is a while since I published my last post here. There are several reasons that I don't write anything, for example, SAP does not publish new features for Analysis for Office or my current project has no special cool new things I can talk about because it is mostly just maintenance and nothing hip. So it was very quiet here, and this is what I want to change. If you follow me on Twitter, you could have seen this post.
The year is almost over, and I haven't written a lot of post on my blog this year. I have to do it a lot more next year. Some #DataWarehouseCloud, #Python and also #ABAP topics are on my list.
— Tobias Meyer (@reyemsaibot) December 17, 2021
So I will write some posts about Python, Data Warehouse Cloud, and some ABAP topics in the near future. This post starts with Python and how to analyze the Apple Health data.
You can export the health data from your iPhone and receive a ZIP file that contains an XML file. How you can do this can be found via Google. It is uncomplicated. In my case, my XML file was around 1 GB big, and it contains about 3 million entries until May 2021. So I could not analyze it with Microsoft Excel or Notepad++, and I need only some information out of it, so I tried Python. I work with Python just more than one year, so please be kind if it is not perfectly written code.


